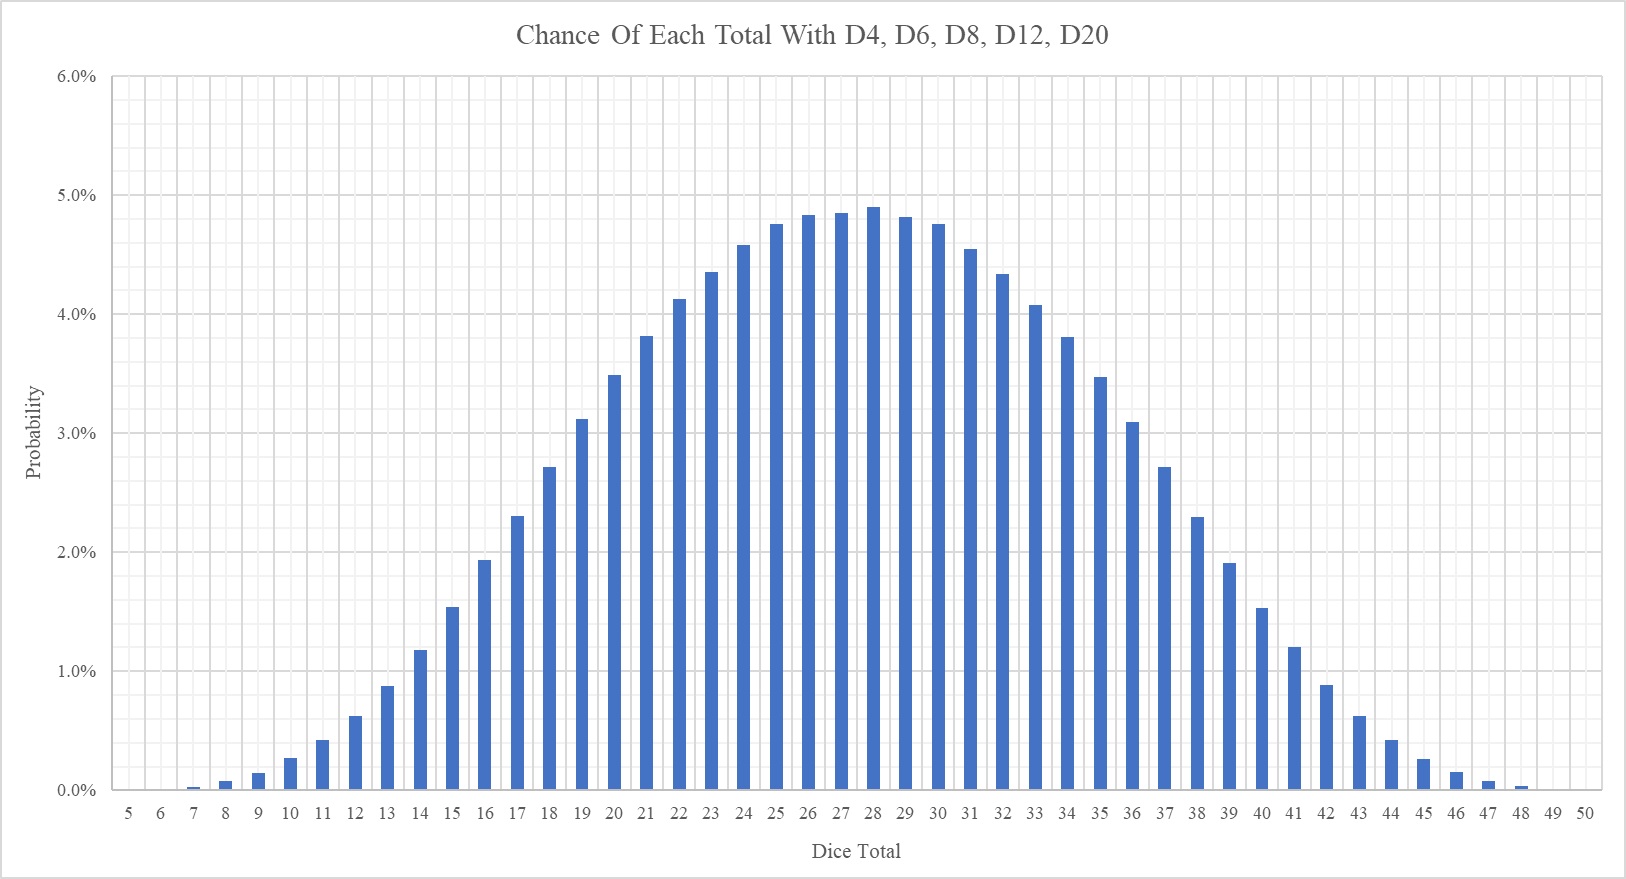
This graph shows the chance of getting each total if all five platonic dice are rolled. The platonic dice are a D4, D6, D8, D12 and D20. The graph was made using a monte carlo simulation on Microsoft Excel.

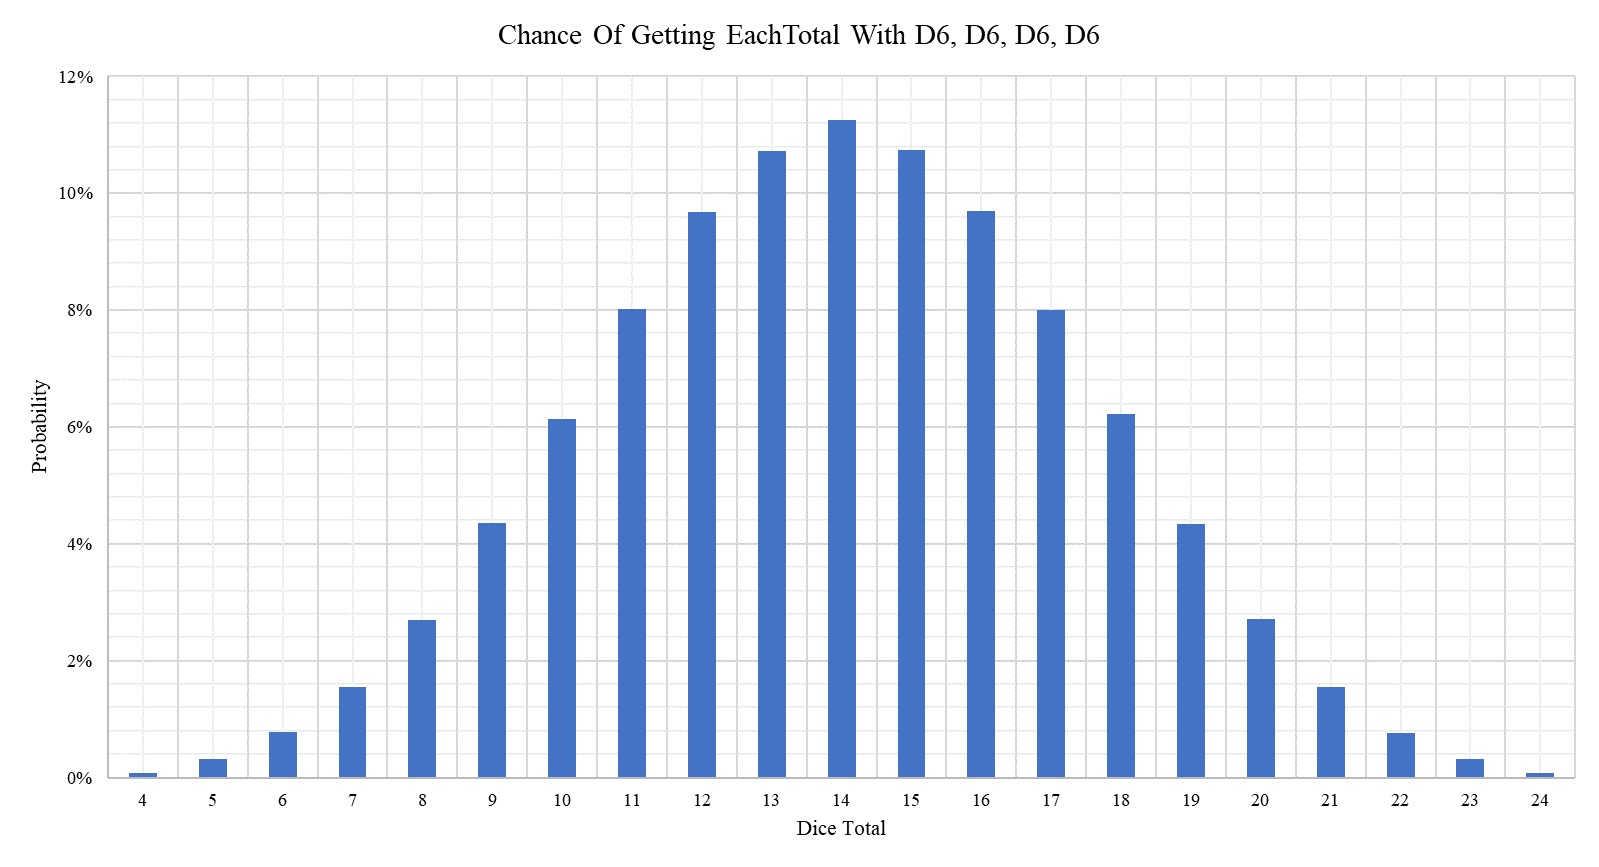
Here is a similar graph for rolling four D6 dice also made using a Monte Carlo simulation on Excel.

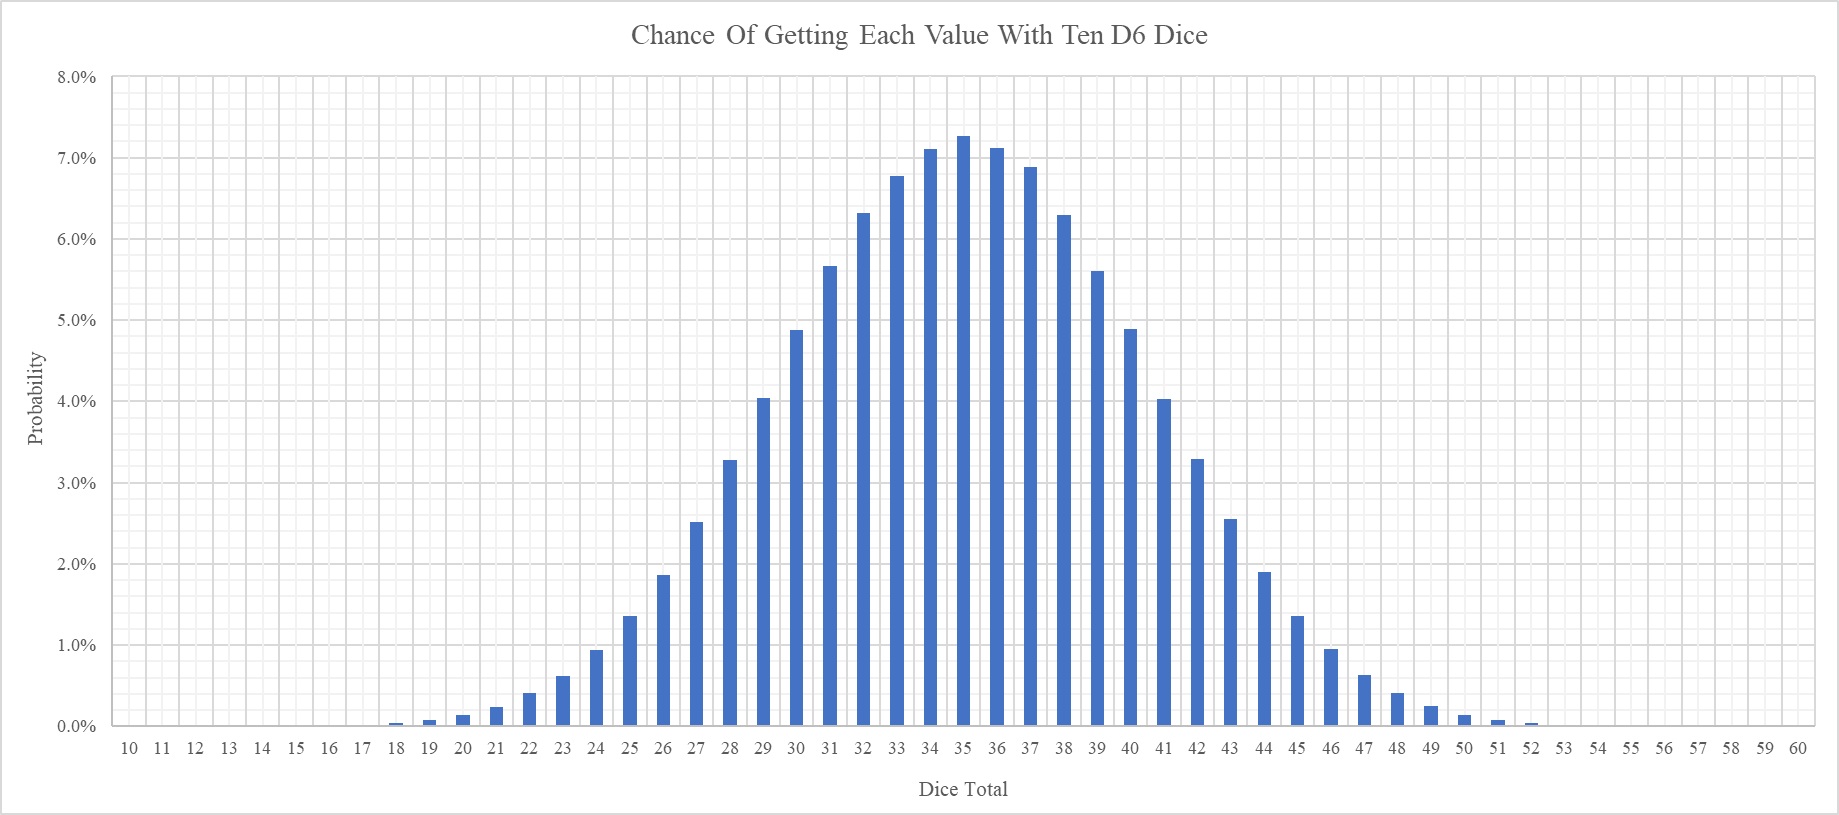
Here is another similar graph for ten D6 dice.

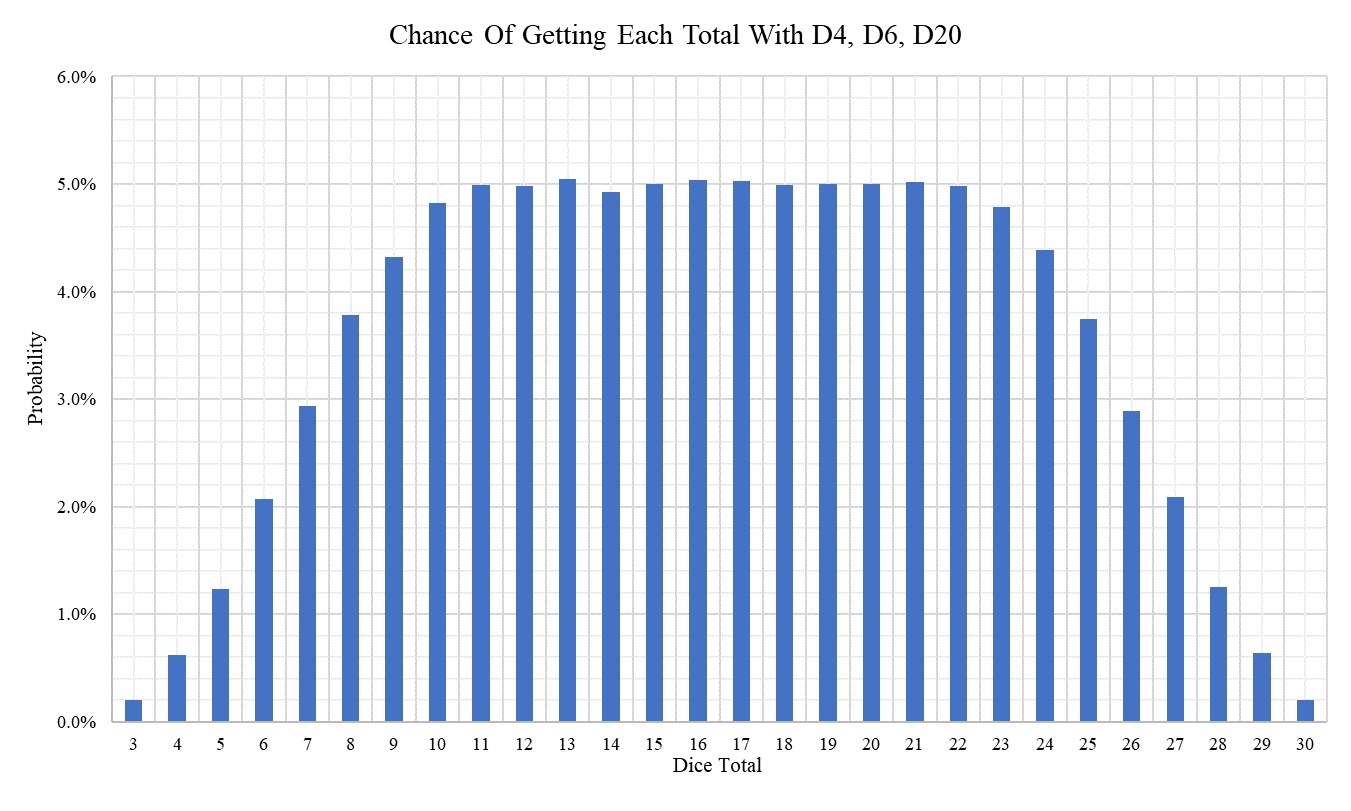
Here is another similar graph for D4, D6 and D20 dice rolled together.
